Multi-Year Trends
How has Chemung County's tax base changed from 2021 to 2025?
Five years of assessment data across all municipalities and property types.
Five-Year Snapshot
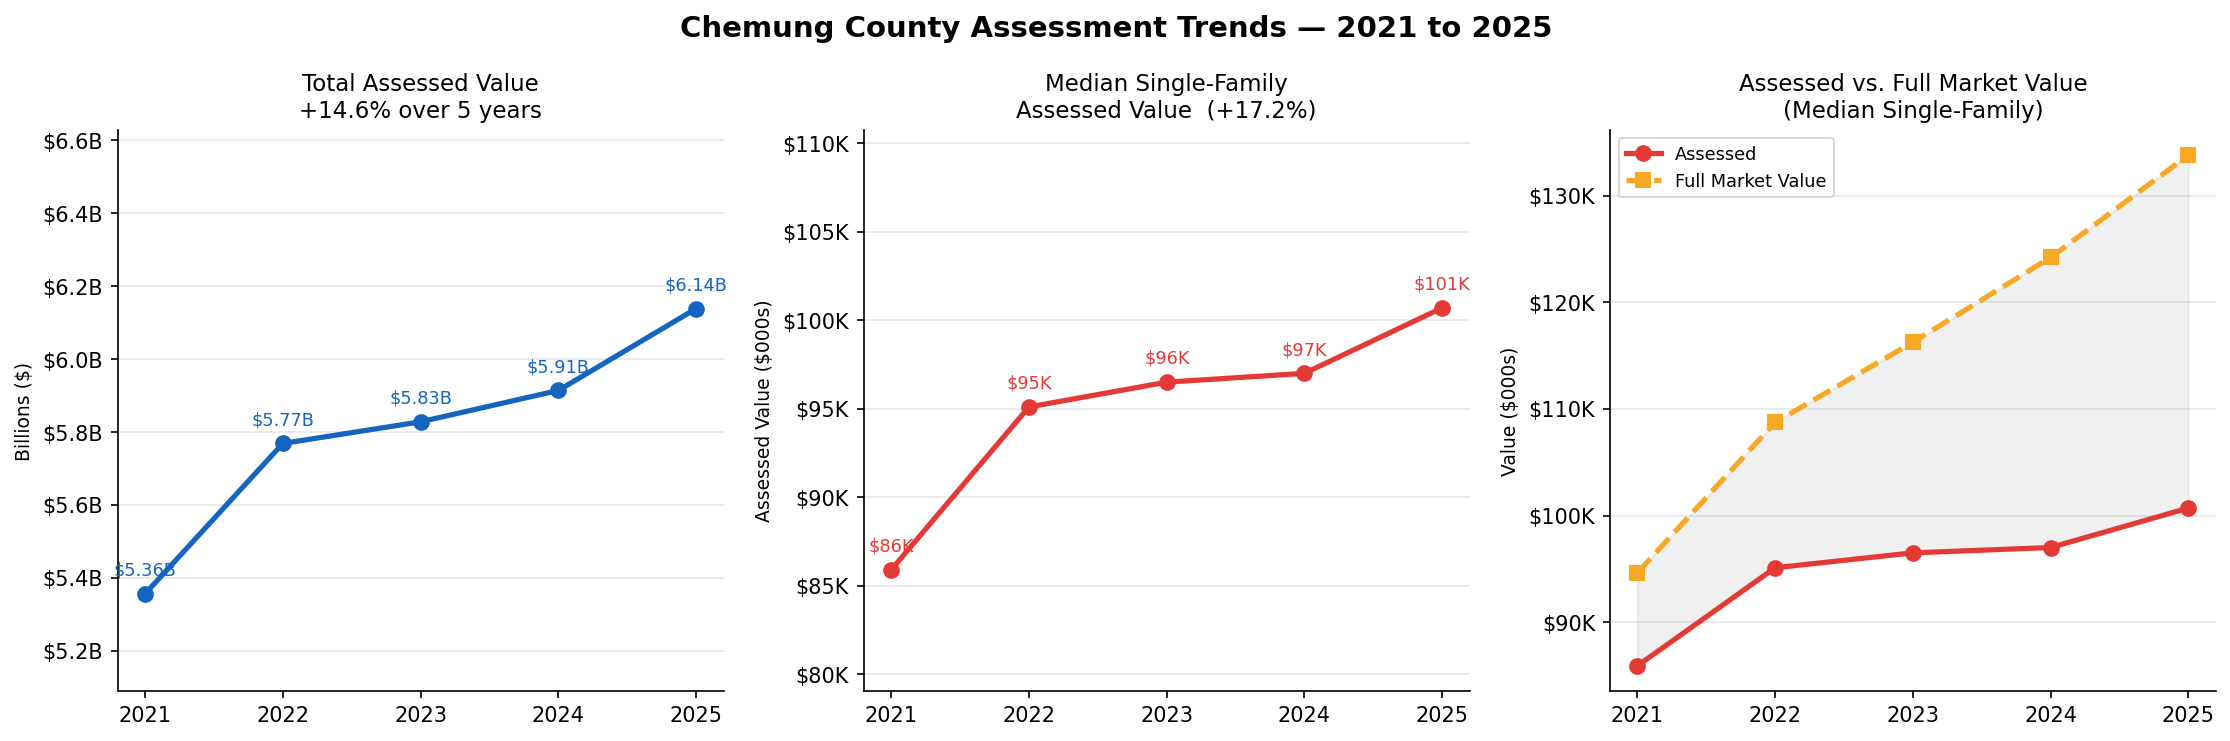
The county's total assessed value grew by $785 million — a 14.6% increase — while
the median single-family home assessment rose from $85,900 to $100,700.
$5.36B
Total assessed value — 2021
$6.14B
Total assessed value — 2025
+14.6%
County-wide assessed value growth
$85,900 → $100,700
Median single-family assessment
+17.2%
Median single-family growth
How property assessment works in New York — the plain version:
Every property in the county has two numbers attached to it: the assessed value
(what the local assessor says it's worth for tax purposes) and the
market value (what it would actually sell for). These are not the same number,
and they don't have to be — but ideally, one is a consistent fraction of the other.
Some towns reassess every year and keep their numbers close to market value. Others
— like the City of Elmira — haven't done a serious update in decades, so their
assessed values are far below what homes are actually selling for. Elmira homes
are assessed at roughly 56 cents on the dollar of actual market value. Horseheads
is closer to 80 cents. This makes direct comparisons across towns tricky.
When the state calculates school and county taxes — which cross town lines — it
applies a correction factor to level the playing field. That correction is what
produced the apparent jump in Elmira's numbers in 2023. It did not change what
any individual homeowner was assessed at. It changed how the state counts
Elmira's roll when dividing up shared tax bills.
What This Means
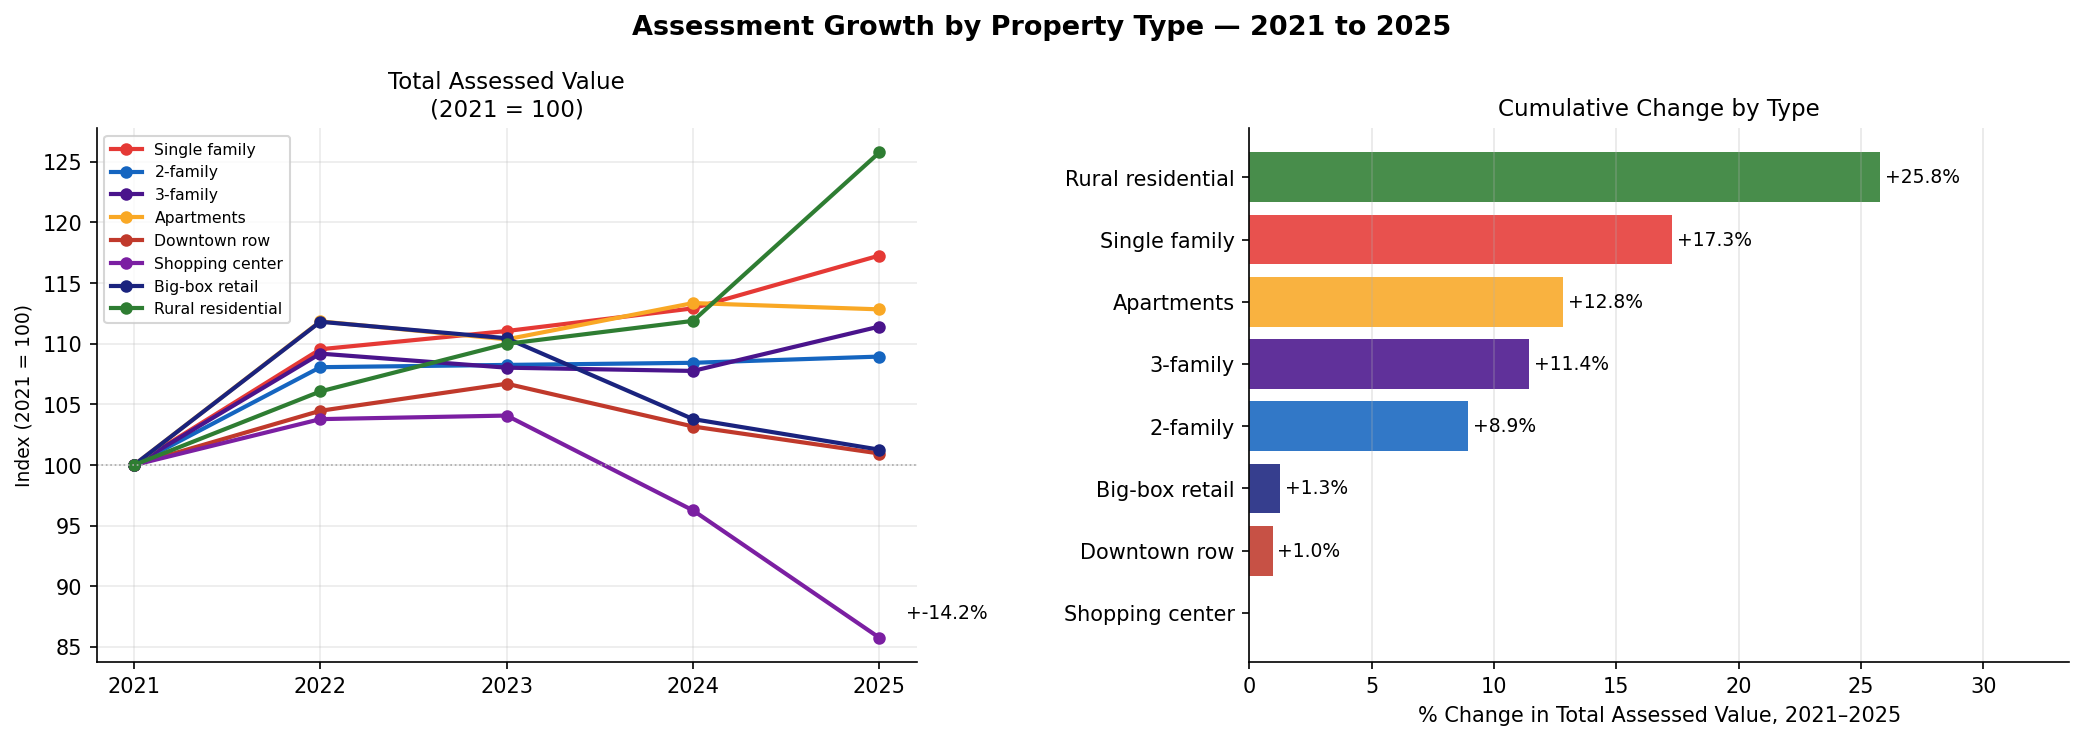
Single-family homes are carrying more of the tax base over time.
The +17% median assessment growth since 2021 outpaces the overall county average of +14.6%.
As homeowners see higher assessed values, they bear a larger share of the total tax levy
unless commercial and industrial assessments keep pace.
The assessed-vs-market gap matters for fairness.
In the right panel of the overview chart, the shaded area between assessed and full market
value represents wealth that exists in the county but isn't yet reflected in tax bills.
When municipalities reassess and close that gap, assessed values rise — sometimes sharply —
even when actual market prices haven't changed much.
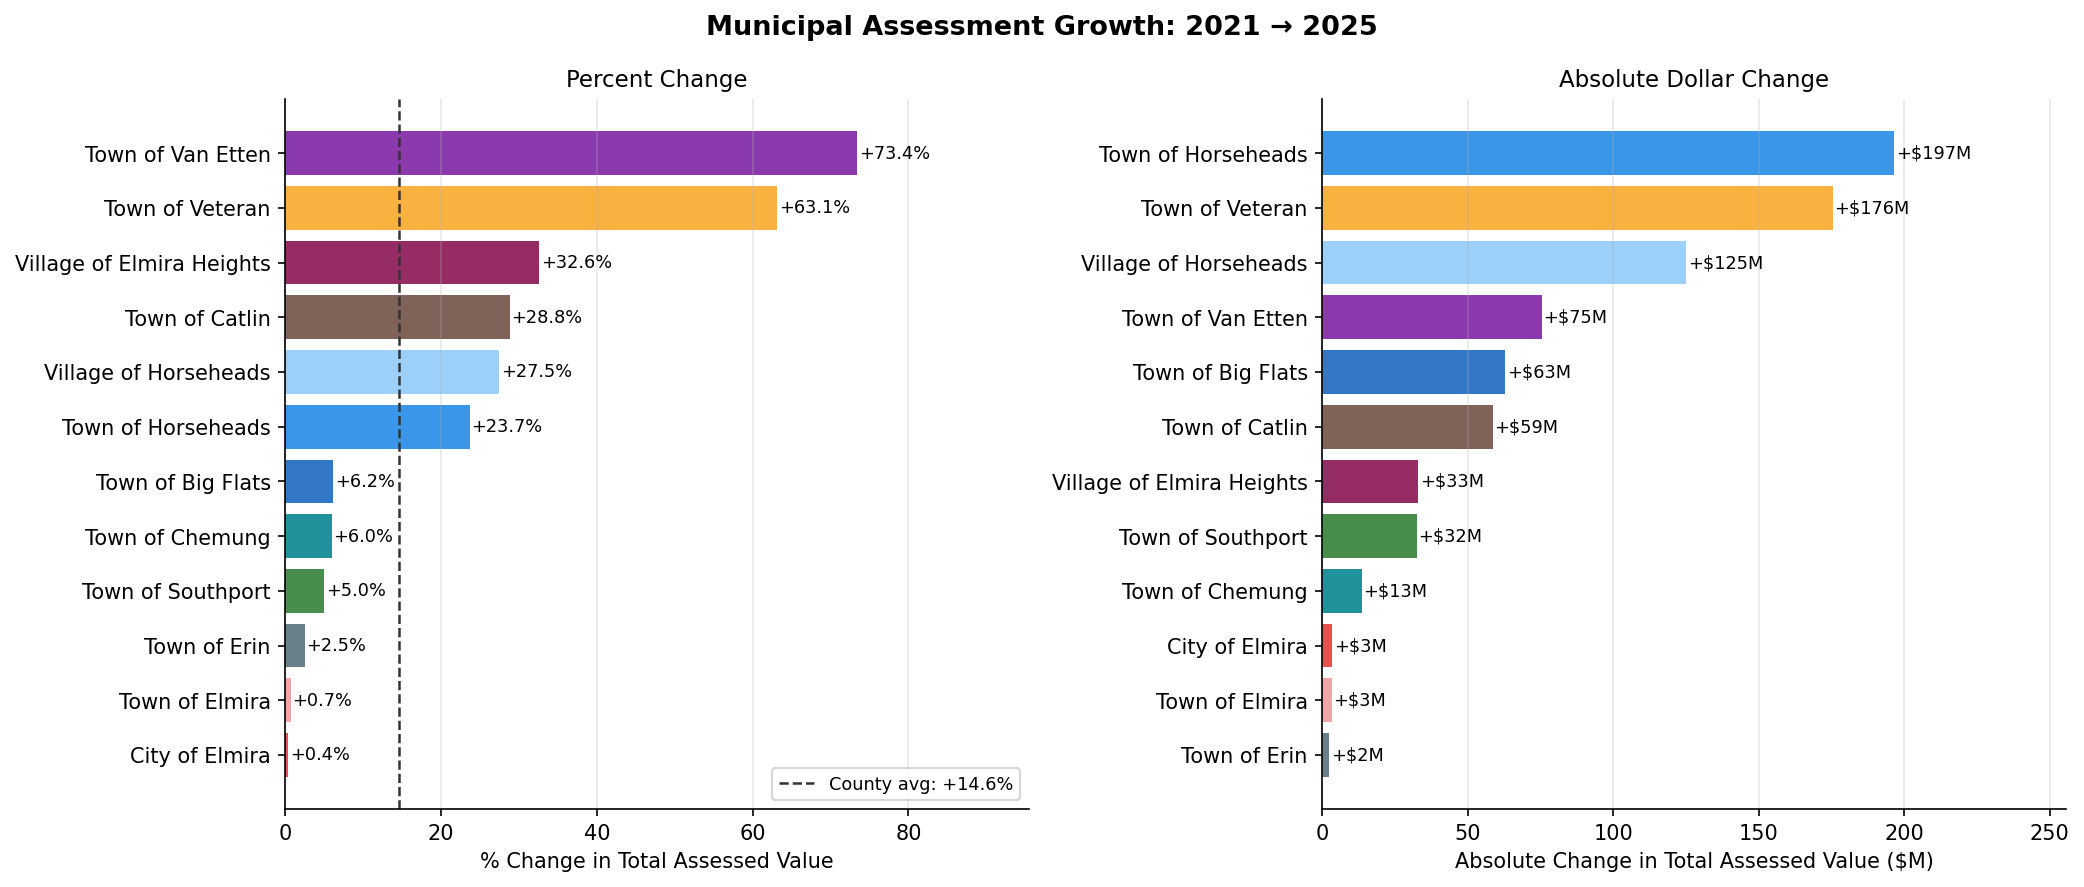
Big Flats and Horseheads lead in absolute dollars.
The Route 17 commercial corridor — Arnot Mall, big-box stores, warehousing — concentrates
a large share of high-value commercial property in those two municipalities. Their dollar
gains dwarf smaller towns even when percentage growth is comparable.
Data: NYS ORPTS assessment rolls via data.ny.gov, dataset 7vem-aaz7. Years 2021–2025.
Each roll year represents values as of the assessment date for that year.
See Data & Methods for full methodology.